


How can a line supervisor, technical or an automation engineer generate data visualization in the era of GenAI? Answer: A single prompt. (Does your Data Analytics Platform do this?)
Step into the era of GenAI based analytics tools that can create simple as well as complex visualization dashboards in minutes. Such dashboards can have interactive features that can let the user slice and dice the data with ease.
Most of you (I am guessing) are stuck either with no access to creating the dashboards that can provide insights that you desire, still use spreadsheets, or depend on IT to create them for you (as usual this option does take ages in an enterprise).
What is the Solution in the age of GenAI?
- You need a platform that is FREE (think OpenSource) with an Enterprise option.
- You need flexiblity to generate dashboards you want with simple code (think Python - Freedom from clicking 100s of menus).
- You need GenAI to generate the code with plain English (think NLP).
- You need the ability to share and take point in time snapshots.
- You need a solution that can support Production Monitoring, Quality Control, Predictive Maintenance, Supply Chain Analytics, Custom Reporting (Visualization to support ML - Machine Learning Models)
Versatile data visualization capabilities is a must. In manufacturing, effective data visualization can significantly enhance decision-making processes, from monitoring production lines in real-time to analyzing quality control and managing supply chains.
What can an AI based Tool do?
- Creating Data Apps: Manage data app design tasks for you, from creating the layout to crafting app interactivity. All the components generated follow industry-standard placement of cards, headers, designs, colors, and code.Enables you to effortlessly push your code and deploy it with a single click — ready to be shared throughout the organization.Use autogenerated code as the starting point for larger-scale projects and save time on coding repetitive design and interface elements.
Data apps give a point-&-click interface to models written in Python, vastly expanding the notion of what's possible in a traditional "dashboard." With Data apps, data scientists and engineers put complex Python analytics in the hands of business decision-makers and operators.
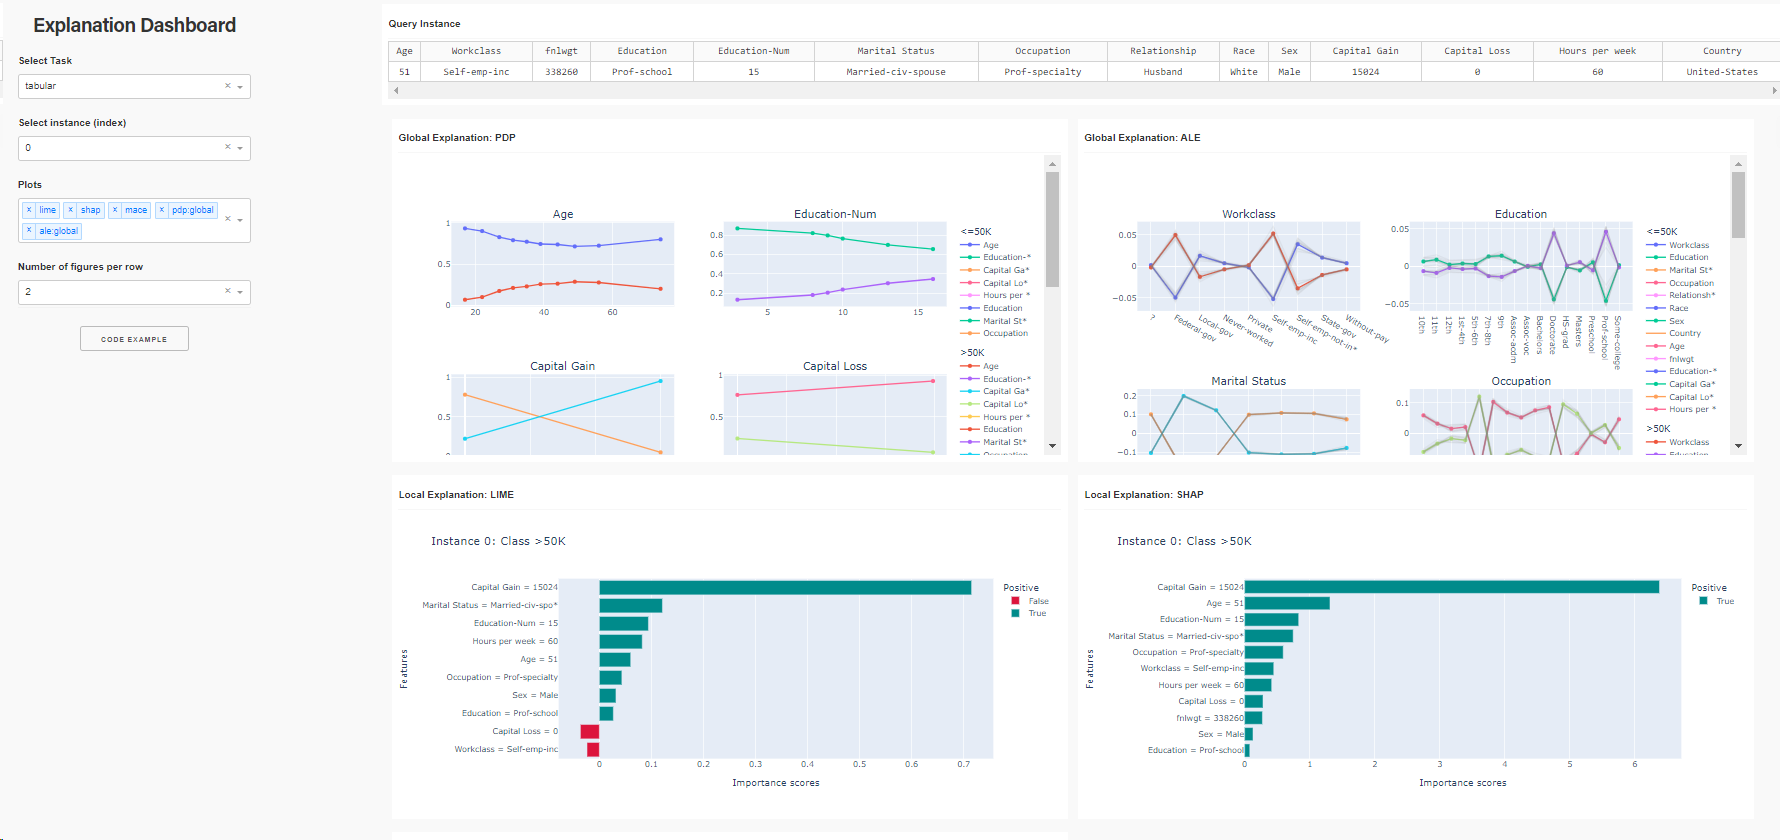
- Smart Insights: Can use an LLM allowing users to ask questions in plain English, enable autogenerated AI insights, set the model response tone, dynamically analyze visualizations in real-time and more. Smart Insights adds an additional layer of insights to graphs to interpret trends, anomalies, and impact based on the underlying data. End-users can also ask questions to generate context-based answers for visualizations.An assistant that helps you make informed decisions: Smart Insights adds a layer of intelligence that exceeds the basic functionality of graphs by extracting key highlights from complex data sets, empowering users to make quick, efficient, and informed decisions.

- Snapshot Engine: Helps you create, annotate, archive, and share point-in-time views of your apps. Share a link to point-in-time views, trigger email and PDF reports, enable on-demand snapshots, draw or comment directly on the app canvas, then share by email....these are the possibilties.
- Data Formats: Pulls information from structured as well as unstructured sources. You can extract knowledge from databases, csv files, PDFs, videos and text.
- Start Small then Scale Up: You an start creating apps with Open Source and then scale up to an Enterprise edition.
- Python Support: Python has taken over the world. Traditional BI dashboards no longer cut it in today’s AI and ML driven world. Production-grade, low-code Python data apps are needed to visualize the sophisticated data analytics and data pipelines that run modern businesses.
"Ultimately the app cuts the 60+ steps down to fewer than 10, and gives our supply planning team both more confidence in the data, and more time to analyze and act against issues/developments." - source: https://tinyurl.com/xlm325854
Conclusion
The fusion of Generative AI (GenAI) with data visualization tools marks a significant evolution, empowering users with the ability to create insightful, interactive visualizations effortlessly. This innovation leverages the strengths of open-source platforms, Python, and natural language processing, enabling a swift, flexible, and intuitive approach to data analytics beyond the constraints of traditional methods.
GenAI-driven tools not only facilitate the visualization of complex data sets but also enhance real-time interaction and analysis, catering to various needs such as production monitoring, quality control, and predictive maintenance.
Features like Smart Insights and Snapshot Engines amplify this capability by offering dynamic, automated insights and sharing options, fostering a deeper understanding and more informed decision-making.
Transitioning to creating interactive data apps, these tools democratize complex analytics, making them accessible to non-technical decision-makers. This breakthrough significantly improves operational efficiency and decision-making processes in manufacturing, setting a new benchmark for data analysis accessibility, efficiency, and impact.
As we step into this new paradigm, the prospects for operational excellence and informed decision-making in GxP manufacturing are unprecedented.
Examples
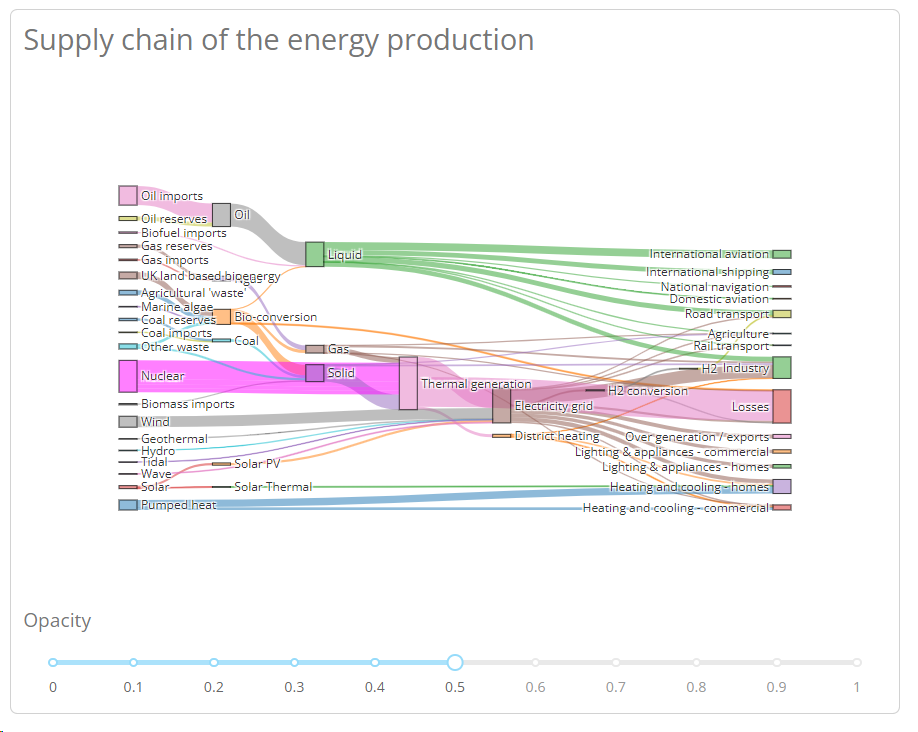
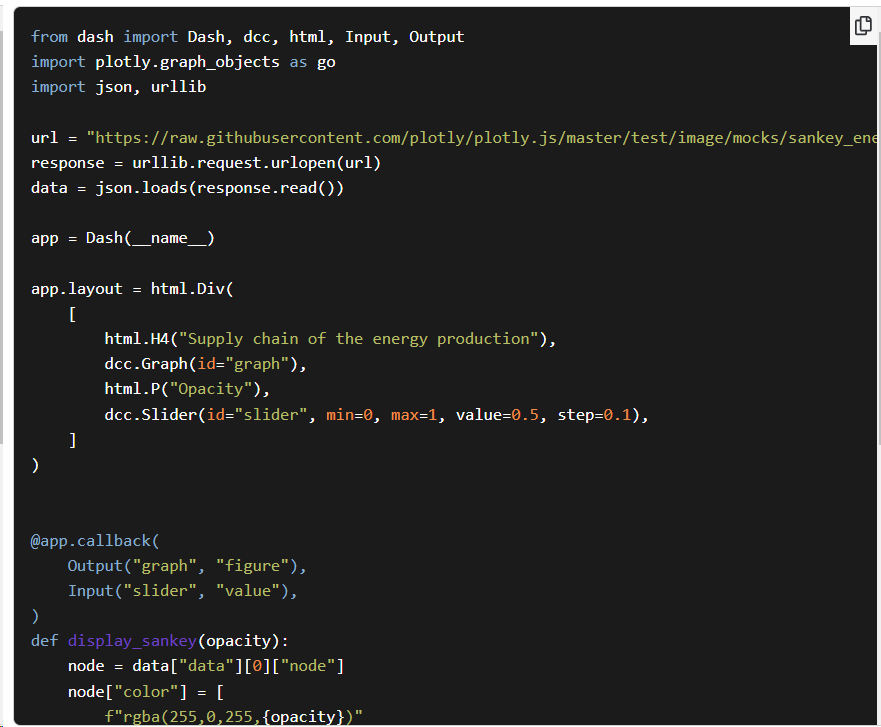
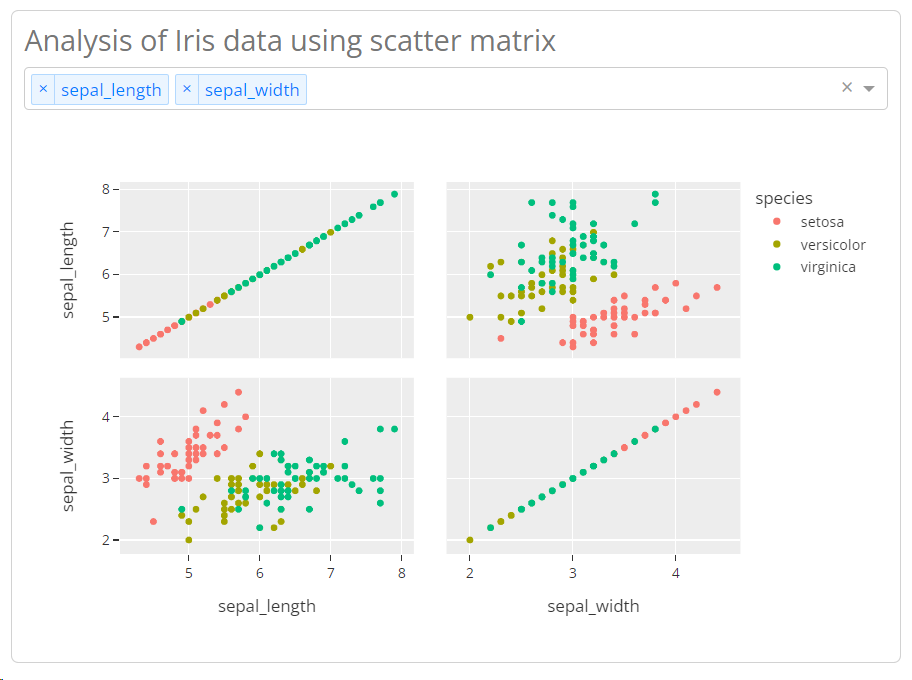
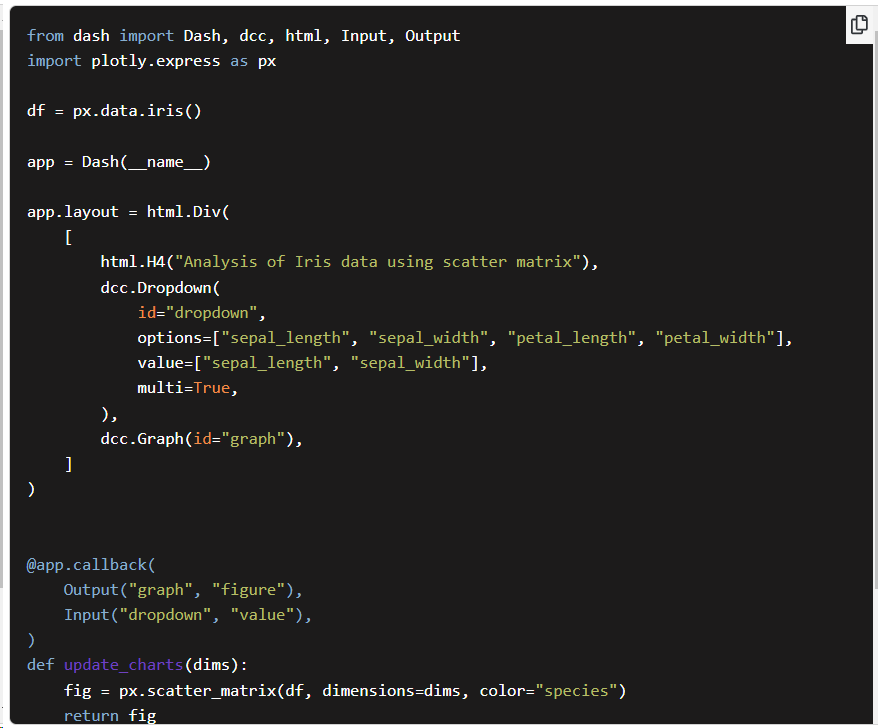
Source: https://dash-example-index
Further Reading
- Multiclass Explainer: Predicting departure port
- High Dimensional Plotting App
- Here is How ChatGPT Will Help You Be a Better Data Scientist
- Life Sciences App Catalog
What questions do you have about artificial intelligence in Life sciences? No question is too big or too small. Submit your questions about AI via this survey here.
COMMENTS